Every argument about bundle size I have been in ends with somebody posting the HTTP Archive chart of page weight. The line goes up and the argument is over. I have posted it myself more than once. In my head the growth was images, bigger photos for bigger screens. JavaScript was a thing we complained about on the side.
I never read how that line is made. This time I wanted a GIF of 15 years of it, so I had to.
How I counted
HTTP Archive publishes the series as JSON on cdn.httparchive.org/reports/. On 8 October 2026 the last crawl there was from 1 September. Before using any number I read the SQL that builds these files in their dataform repository. Only home pages are counted and 1 KB is 1024 bytes. The median for images or JavaScript is taken only over pages that have that type, so the parts do not add up to the whole page.
I took the desktop series and the July crawl of every year. The counting is Python 3.12 and the GIF is matplotlib 3.11. Gifsicle 1.94 squeezes it.
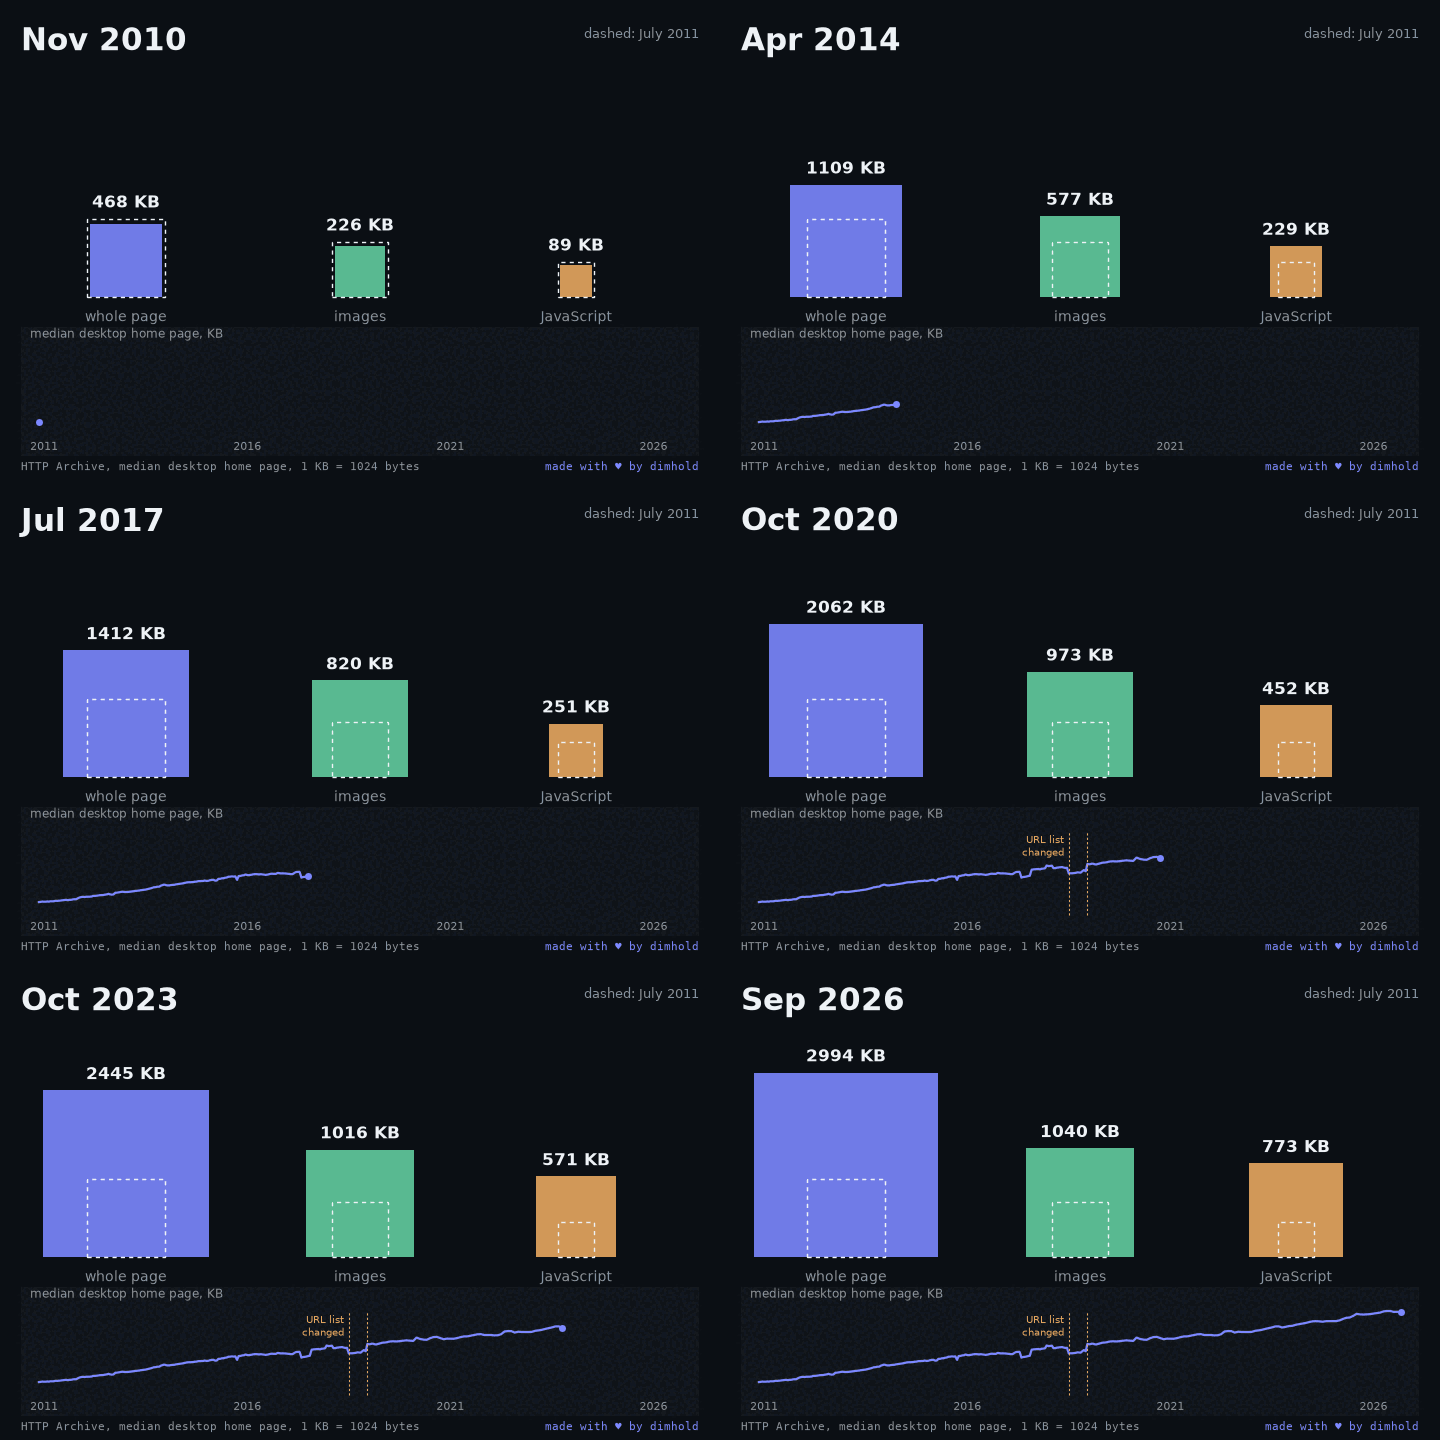
What grew
In July 2011 the median desktop home page was 540 KB, in July 2026 it is 3009 KB, 5.6 times more. Images went from 269 to 1062 KB and JavaScript from 109 to 767 KB, 7 times. Requests barely moved, from 64 to 76, so the files got bigger.
My picture was half right. Images are still the largest part, but their line in the GIF stops. From July 2019 to July 2026 the median image weight went from 987 to 1062 KB, 8 percent in 7 years, while JavaScript almost doubled.
The summer the web got lighter
The first thing I noticed in the frames was a drop. On 15 June 2018 the median page was 1709 KB and on 1 July it was 1503 KB, images fell from 864 to 650 KB. I spent a while looking for what happened on the web that month and found nothing.
HTTP Archive keeps a changelog. On 1 July 2018 the crawl switched to 1.3 million URLs from the Chrome UX Report. The URL count in the data goes from 461 thousand to 1.28 million. On 15 December 2018 the list was synced with the whole report, 3.84 million pages. The median went up 17 percent in 1 crawl, images 41 percent.
Over all 281 desktop crawls the median change between 2 neighbouring crawls is 0.89 percent. These steps are 14 to 19 times that. There are 2 more of the same size in 2017. On 1 May the test agents moved to Linux and the median fell 13 percent. On 1 August it went up 15 percent with no changelog entry. HTML alone went from 29 to 14 KB in May and back to 28 KB in August. I think this is the measurement, pages do not lose half of their HTML for 3 months. Steve Souders wrote about method changes bending this series back in 2013, I only found the newer ones.
The list kept growing up to 13.2 million home pages in March 2025, the September crawl has 11.4 million. Rank slices exist since May 2021, so I checked if recent growth is just a different crowd. The 1000 most visited sites went from 1704 to 2843 KB in these 5 years, faster than the whole list.
Where the images went
In July 2017 the median home page made 41 image requests, in July 2026 it makes 19. Over the same years the share of pages with loading="lazy" on an image went from 0 to 42.5 percent.
Lazy images load when they come close to the viewport, so I checked the viewport. The crawl configuration in HTTPArchive/crawl opens desktop pages in a 1920 by 1080 window and mobile pages at 360 by 512. I found no scroll step there or in their fork of wptagent. Pat Meenan, the author of WebPageTest, answered the same question on the HTTP Archive forum in April 2021. Lazy images outside the viewport are not loaded, so they are not measured. He called that accurate for the initial load. In the same thread he wrote that the desktop window was 1024 by 768 until that month, so in 2019 even less of the page was in view.
Accurate for the initial load is fair, but it is not the weight I had in mind when I posted the chart. The Web Almanac of 2021 guessed that lazy loading is why pages make fewer image requests, without a measurement. I did not find anyone who counted the bytes below the fold.
My run
My crawler is Playwright 1.64 on Node 22 with Chromium 156. For every site it opens a fresh context with the cache off and a 1920 by 1080 window. It loads the home page and waits for 2 seconds of network silence, 30 seconds at most. This is what a crawler that does not scroll would see. Then it stands still for 10 seconds as a control. Then it scrolls to the bottom by 80 percent of the window every 400 ms and waits again. Bytes are transfer sizes.
The sites are 300 random domains from the Tranco top million (seed 699). 185 loaded and 167 weighed at least 100 KB, which cuts parked domains. 45 percent of them have a lazy image, close to the 44.6 percent HTTP Archive reports for September.
Before the run I wrote down what would prove me wrong. The median page gains less than 3 percent from scrolling, the median page with lazy images less than 5 percent. Both happened, 0.1 and 4.1 percent. 43 percent of pages did not load a single byte more. Standing still added 1.5 percent of all bytes. Scrolling added 12.6.
But the chart shows the median page, not the median gain. The median of my whole sample after scrolling moved from 2943 to 3568 KB, 21 percent up. Images moved from 1187 to 1647 KB. I looked for a bug in my script for a while. Pages with lazy images are heavier, 3901 KB at the median against 2352 KB without. 8 of the 83 pages below the median ended above it after scrolling. I chose this second measure after the run, so I trust it less. With 167 pages the 95 percent bootstrap interval is wide: 7 to 40 percent for the page, 12 to 77 percent for images.
Then I ran the first 200 of the same domains as a phone, 360 by 512 at device pixel ratio 3. 120 pages counted. The median page with lazy images gained 11.7 percent, above my threshold. A third of all pages gained 10 percent or more. The median of the sample moved from 2915 to 3806 KB, 31 percent up, with an interval from 5 to 62 percent. The Web Almanac of 2022 guessed that phones show fewer images than desktops because lazy loading does not fire on a small first screen. My phone run fits that guess.
Most of the bytes that came during scrolling were images, 75 percent on desktop and 71 on the phone. Whether this explains the flat image line I can not say. My run is one day in 2026 and in 2019 lazy loading was done mostly by JavaScript, which I can not replay now.
What I did not check
- My sample is Tranco domains, not the CrUX list HTTP Archive uses. One run per page from one server.
- About a third of the desktop pages never went quiet before scrolling, so some of their scroll bytes may be background traffic. In total the scrolling brought more than 8 times the bytes of the control phase, but per page I can not separate them.
- HTTP Archive also reports a Lighthouse estimate of offscreen image bytes. I did not compare my numbers with it.