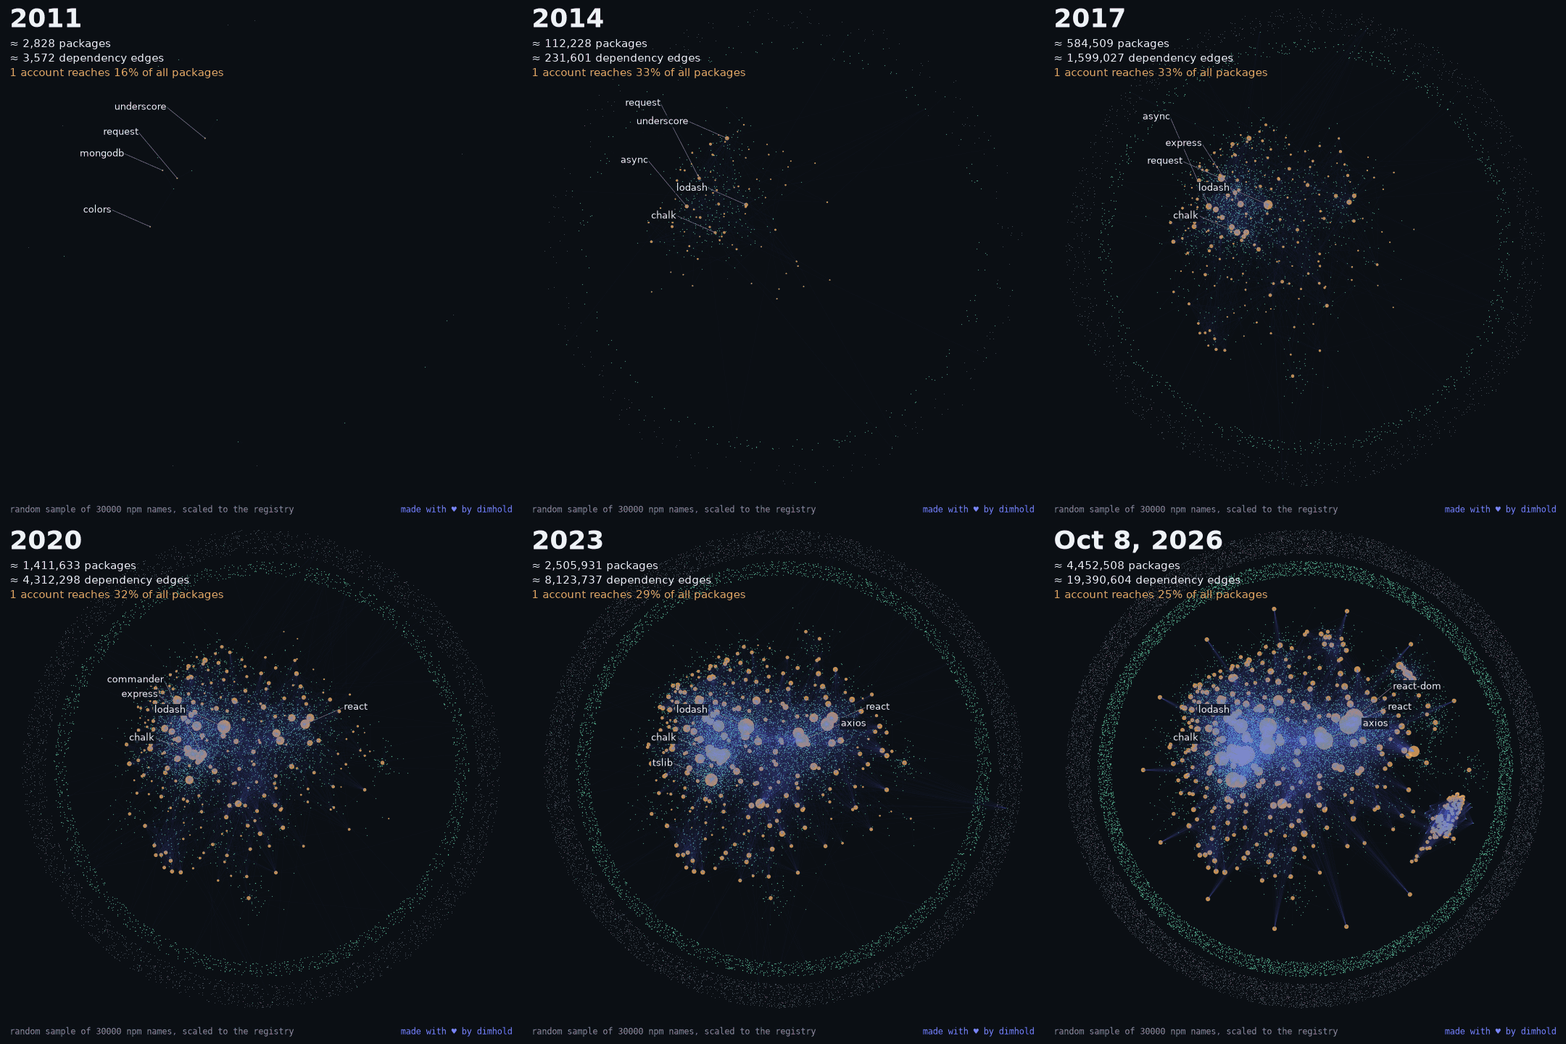
There is a picture of npm I have had in my head for years. It is Andrei Kashcha’s Software Galaxies, the whole registry drawn as a cloud of stars. I wanted the same picture but moving, one frame per year, to see the thing grow. His npm data stops at a snapshot from November 2020, so I had to build my own.
I also had an opinion ready before I counted anything. In 2019 Zimmermann and colleagues wrote that 20 maintainer accounts reach more than half of npm. I always filed it under the left-pad years. The registry grew from under a million packages to about 4.5 million since then, so I assumed the power had spread out with it. I never checked this, I just liked how it sounded.
How I counted
On 8 October 2026 the replication endpoint of the registry listed 4465309 package names. Downloading all of them was not realistic, so I took a random sample of 30000 names and downloaded their full package documents. For every year from 2011 to 2026 I took the highest version that existed on 31 December of that year and its dependencies. 2026 is cut at the start of 8 October. Then I followed those dependencies down until nothing new was missing, which took 98736 package documents in the end.
These rules matter for every number below. A package exists in a year if it has a version with a date before the cut. An edge is one line in dependencies of that version, without dev or peer dependencies. Counts for the whole registry are the sample scaled by 4465309 / 30000. The counting is plain Python 3.12. The GIF was laid out with networkx 3.6, drawn with matplotlib 3.11 and packed with gifsicle 1.94.
Before trusting it I compared it with the old papers. Zimmermann had 1.3 direct dependencies per package in 2011 and 2.8 in 2018, I get 1.26 and 2.91. A 2026 paper by Robinson and colleagues found 61.3 percent of packages with at least 1 dependency, I get 60.7. Close enough to go on.
Nodes and edges
At the end of 2011 the sample says about 2800 packages and 3600 edges. On 8 October 2026 it is 4.45 million packages and 19.4 million edges. Up to 2024 edges grow faster than nodes every year, which Kikas and colleagues already saw in 2017. In 2025 and 2026 it is the other way around.
Then came 2024 and I thought I had a bug. Edges doubled in 1 year, from 8.1 million to 16.1 million, while packages grew by 28 percent. The average number of dependencies jumped from 3.24 to 5.02.
It was not a bug. Packages created in 2024 are 4724 in the sample and they carry 53391 edges, that is 41 percent of all edges in 2026. 431 of them have 20 or more dependencies and 81 percent of their edges go to other packages created in 2024 or later. The packages they point to have names like gain-pleasant-prepare and anywhere-dream. I opened the tarballs of those 431 and 430 could be read. 52 contain tea.yaml, the file of the tea.xyz reward protocol. Among 1376 packages created in 2023 with at least 1 dependency there were 0. So part of it is farming for that protocol and the rest I can not attribute.
I found them the annoying way. My download of the closure would not finish. Round after round 16 to 18 names were still missing, because cadutdudut_128 depends on cadutdudut_127, which depends on cadutdudut_126 and so on. I stopped with 15 names not downloaded. 11 of them are the next link of such a numbered chain, the other 4 hang off packages from the same months, March to May 2024. They change the closure sizes of spam a bit and nothing else.
Who holds the graph
First the direct edges. In 2015 the 100 most used packages received 43 percent of all edges in the sample. In 2018 it was 34 percent, in 2023 it was 28 and in 2026 it is 20. Part of the last drop is the spam of 2024, because its edges go to each other. Still, on this measure my opinion was right and the graph spread out.
Then the transitive picture, which is what matters if an account gets stolen. For each package in the sample I took every package it pulls in through dependencies and every account listed as maintainer of those versions. Then I asked how many packages each account reaches.
The top account reached 35 percent of all packages in 2015 (substack), 33 percent in 2018 (isaacs) and 25 percent in 2026 (sindresorhus). All packages here means including the 39 percent that have no dependencies at all and can not be reached by anyone. Among packages with at least 1 dependency, 2 accounts are enough for half of them in every year since 2021.
How many accounts reach half of everything, in the same greedy order Zimmermann used: 11 in 2018 and 17 in 2026. I would not trust these to the unit. When I split the sample into 2 halves the result was 10 and 12 for 2018 and 14 and 19 for 2026, so the honest answer for today is “between 14 and 19”. The share of the top account is stable, 25.0 and 25.5 percent on the 2 halves.
My count is not the same as theirs. They used the full registry up to April 2018, I used a sample and the highest version of each package. My 11 for 2018 against their 20 can be this difference and I would not read more into it.
So from 2015 the share of the top 100 packages in direct edges halved, but the reach of the top account went only from 35 to 25 percent. A quarter of npm still depends on one account. Some of the 17 accounts are not people: types is the account behind almost every @types package and react-bot, judging by the name, is a release bot of React.
What I did not check
- “Maintainer” is the list in the version document. Being on the list says nothing about who publishes, who has 2FA or who uses trusted publishing.
- Packages that were unpublished or removed are missing from the registry today, so the early years are counted low. I do not know by how much.
- One version per package per year, without resolving the range of the parent. A real install can pull a different version with different dependencies.
- One random sample, one run. Early years stand on very few packages, 104 in 2012 and 754 in 2014, so I would not read anything from those years beyond the trend.
I still do not have a good picture of what to do with these 14 to 19 accounts. Most of them are people who did nothing wrong, they wrote small packages early and everybody depends on them.