Everybody has seen these GIFs: a city from space, one frame a year and the grey area gets bigger every frame. Google Earth Timelapse published such timelapses for the whole world last year. I always believed what they show and never asked how much of the movement is the city. This autumn I wanted one for Minsk, 10 years of it from Sentinel-2, because its data is free.
10 years was not possible. Sentinel-2A was launched in June 2015 and the first scene over the city in the archive is from 29 July 2015. In December 2022 there are 7 full summers, 2016 to 2022. For 10 years I would need Landsat at 30 metres.
The first GIF
I took the Sentinel-2 L2A scenes from Planetary Computer for tile 35UNV. The window is about 32 by 28 km and holds the city with the ring road and the suburbs. For every summer, May to September, I picked the scene with the fewest clouds in the window and put the 7 frames together.
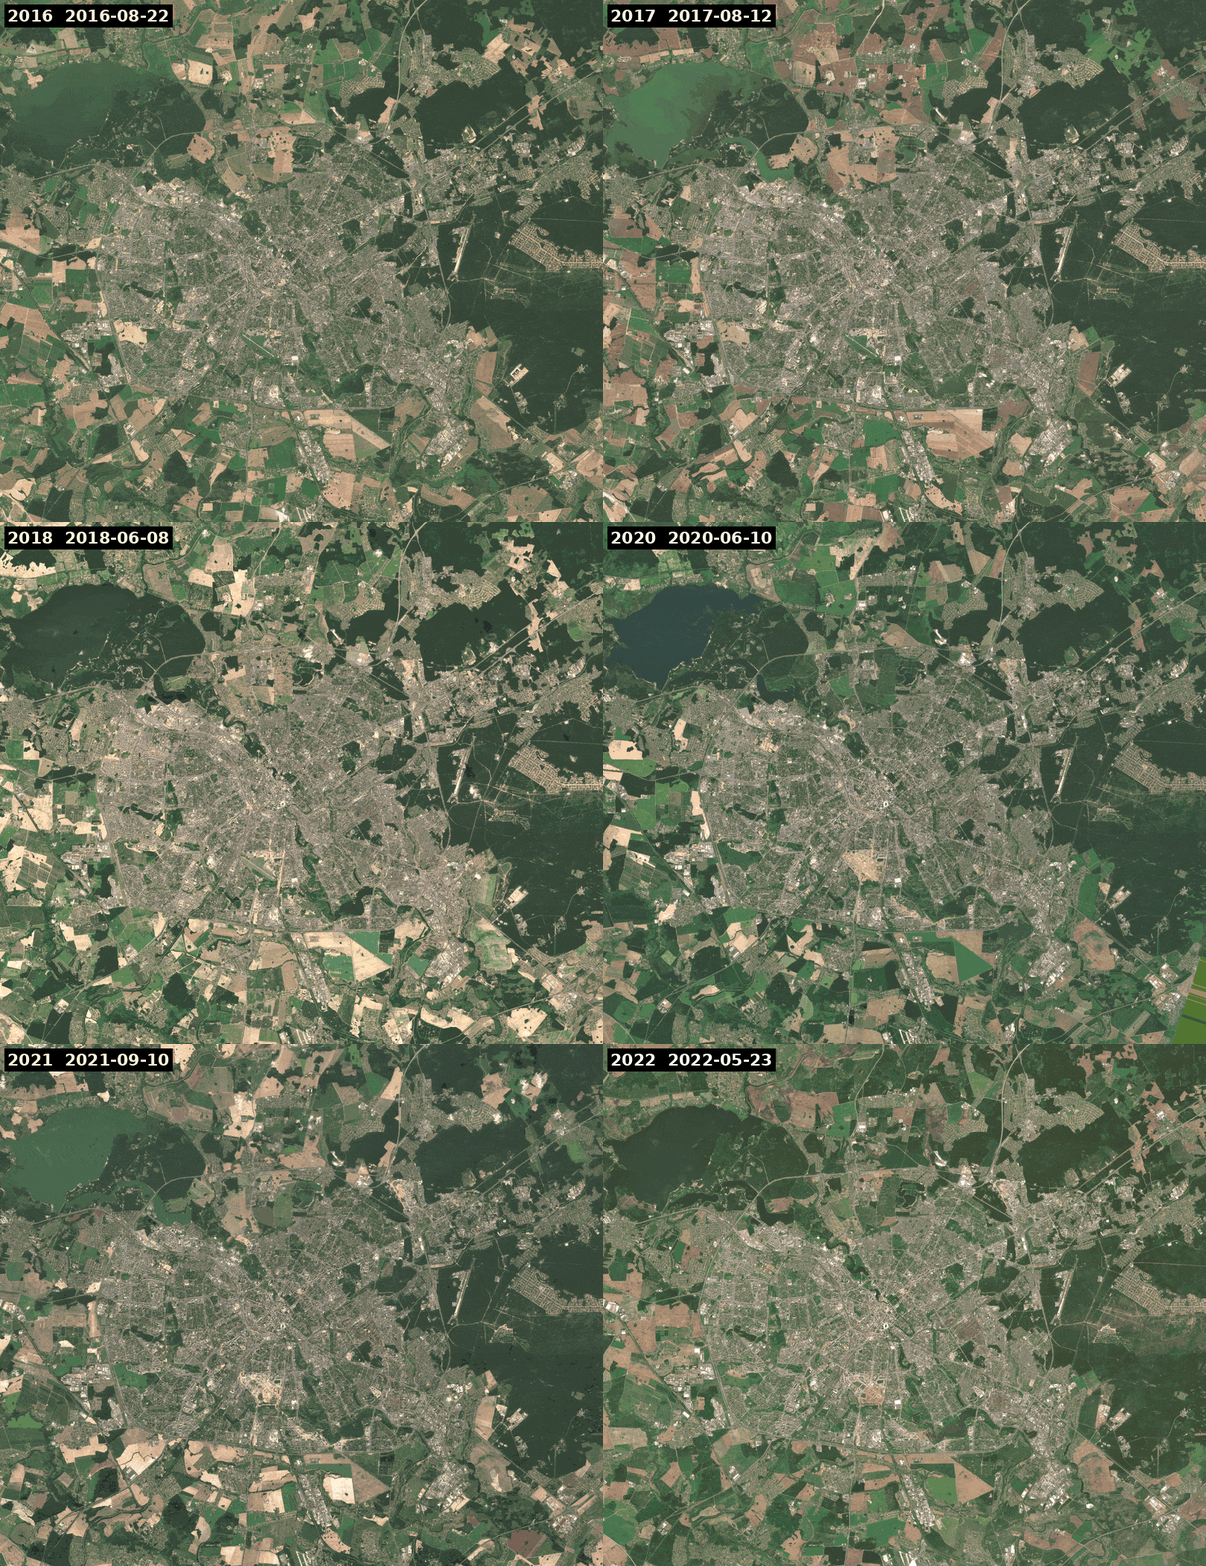
It looked like a growing city, with fields jumping between brown and green and the reservoir in the north west changing colour. Then I tried to count it. A pixel is “bare” when its vegetation index (NDVI) is under 0.25 and it is not water. Between the frame of 22 August 2016 and the frame of 23 May 2022, 64 km² became bare. At the same time 51 km² stopped being bare, so the net is 13 km² on top of 108. If I read only the gains, as the eye does on a GIF, the bare area grew by more than half in less than 6 years.
I checked what lies under those 64 km² on the ESA WorldCover map for 2021. 60% of it is cropland. In May many fields have nothing grown on them yet, so they look like bare soil. My index cannot tell them from a new block of flats. Only 5% of the 64 km² got into the stricter count below.
Medians instead of single scenes
The usual fix is a median. For each summer I took up to 12 clearest scenes and masked clouds and shadows with the scene classification layer (SCL) of L2A. Every pixel keeps its middle value. Then I counted pixels that change their state, bare or not bare, at least 2 times over the 7 frames. With single scenes it is 157 km², with medians 59 km², which is still a lot. The single scenes are counted on a smaller area, because more of their pixels are masked.
The bare area by medians stays between 81 and 87 km² every year with no trend, the most in 2018.
There was one more trap in the 2022 data. From 25 January 2022 ESA processes scenes with baseline 04.00, which adds 1000 to every reflectance value. I subtracted it. Without that, the same rule gives 154 km² of bare land in 2022 instead of 83 km².
A rule that needs a pixel to stay changed
So I asked for more than one frame. A pixel is new city if it was green (NDVI 0.5 or more) in both 2016 and 2017 and bare in both 2021 and 2022. It also has to lie in a patch of at least 5 pixels. This gives 3.46 km² in 854 patches. The reverse, bare to green with the same patch rule, gives 0.51 km².
I did not trust this number either. So I drew 120 random pixels from those patches and looked at each in the medians of 2016, 2019 and 2022. My guess was that fields and forest clearings would be at least half of them. I was wrong. 77 pixels had a building, a road or a paved yard by 2022. 33 were construction sites or land cleared for one. 1 was a field and 9 I could not read at 10 metres, mostly in areas of private houses.
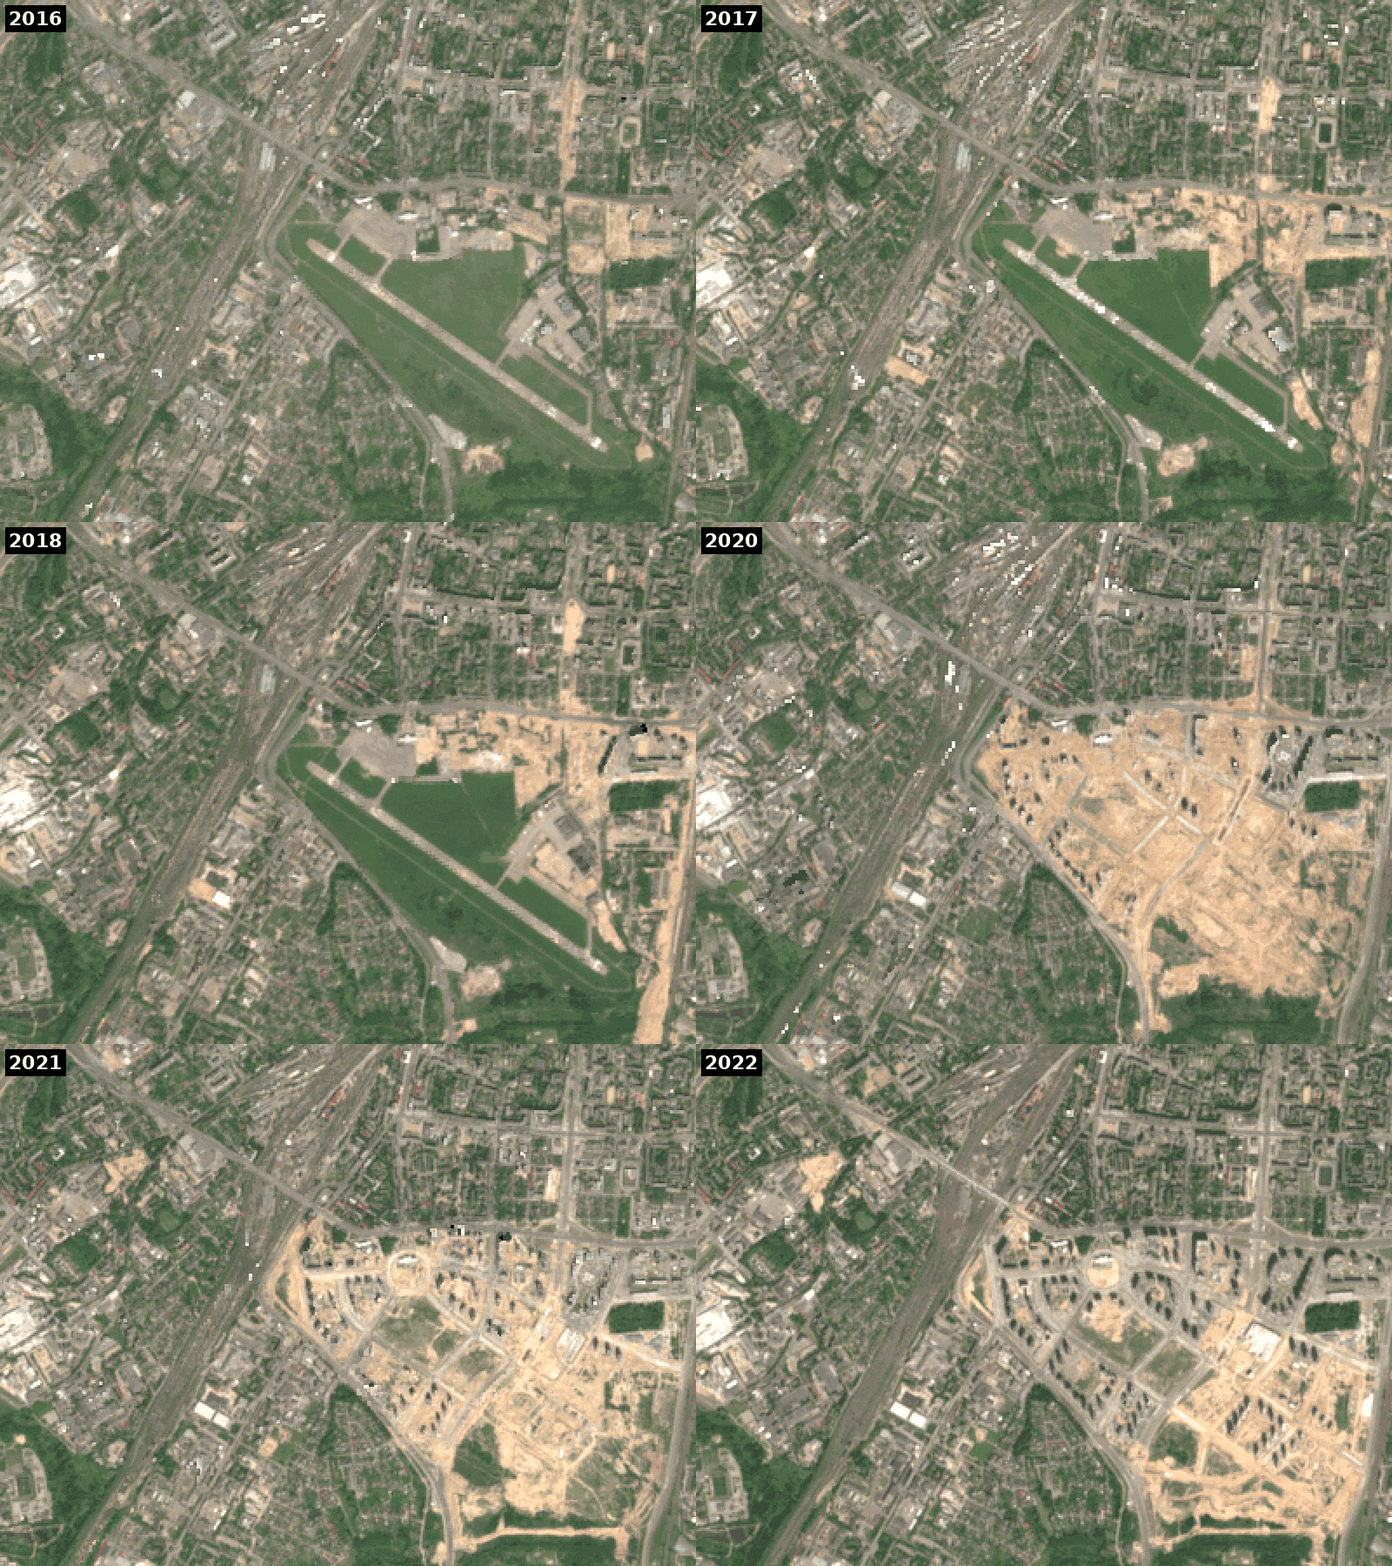
20 of the 120 pixels fell on one place, the former Minsk-1 airport. It was closed on 23 December 2015, so the first Sentinel-2 summer shows the runway still there. In the medians it lies in a green field until 2018 and sand comes in 2019. By 2022 the north west half has blocks of flats on it. Within 1 km of the middle of the runway lies 0.54 km² of the change, 15% of all of it in the window. The largest single patch is there too.
Checking against ready maps
Before counting I planned to compare with 2 ready maps. The first is GHSL from the European Commission, release R2022A from this summer, with built surface every 5 years. On my grid it gives 73.9 km² of built surface in 2015 and 77.2 km² in 2020, so 3.3 km² more. My 3.46 km² for 2016 to 2022 is almost the same and I was glad about it.
Then I looked where these 3.3 km² are. 7% of the GHSL growth lies within 100 metres of my patches. That strip covers 3.4% of the window, so it is about twice what chance gives. Still the other 93% lies elsewhere. On cells of 500 metres the 2 maps correlate at 0.06. At the airport GHSL hardly moves: on my changed pixels its built share is 4.6% in 2015 and 4.9% in 2020. Then I read the GHSL description properly. It looks at the ground with Landsat in 2014 and with a Sentinel-2 composite of 2018. The epoch 2015 is interpolated and 2020 extrapolated, with a model that uses terrain, distance to water and the growth seen before, among others. So its 2020 number is not an observation.
WorldCover is worse for this question. The 2020 map was made with algorithm v100 and the 2021 map with v200. The release notes warn that changes between the 2 maps come from both the land and the algorithm. In my window the built class grows from 153.9 to 186.8 km² in one year, while my rule gives under 1 km² per year.
What I take from it
In my window around Minsk the number is about 3.5 km² in 6 years, construction sites included. I think the real number is more likely higher than lower. A pixel had to be green 2 summers in a row before the change. Land built in small pieces does not pass the patch rule. But I did not measure what the rule missed.
What I did not check
The thresholds 0.25 and 0.5 I chose once and did not tune. Land cleared before 2016 is not in the count and the window also holds villages outside the city. I labelled the sample alone at 10 metres, someone else could put a few points in another group. Where old houses with gardens were replaced by new blocks, my rule would count it as new city, although the land was built on before. A taller building in place of a lower one is not visible to it at all.
2.2% of the window had no clean pixel in at least one summer and is out of the count. I first thought the mask takes bright roofs for cloud. The classes say otherwise: about half of these pixels are “unclassified” and a third “dark area”, 2 classes my own mask threw out. In the GIFs I filled the holes from the nearest pixel.